Wok ring / flame concentrator
Focuses flame toward the wok base to reduce side-wall heat loss. This improves heat transfer efficiency and usually cuts burner-on time.
Typical gas saving: ~10–25%
Browse your venue inventory — select a unit below or open the full list to jump into a deep dive. Sustainable alternatives appear further down the page.
Professional profile for restaurant equipment assets with performance and comparison context.
.jpg)
Fuel → food, not → kitchen air
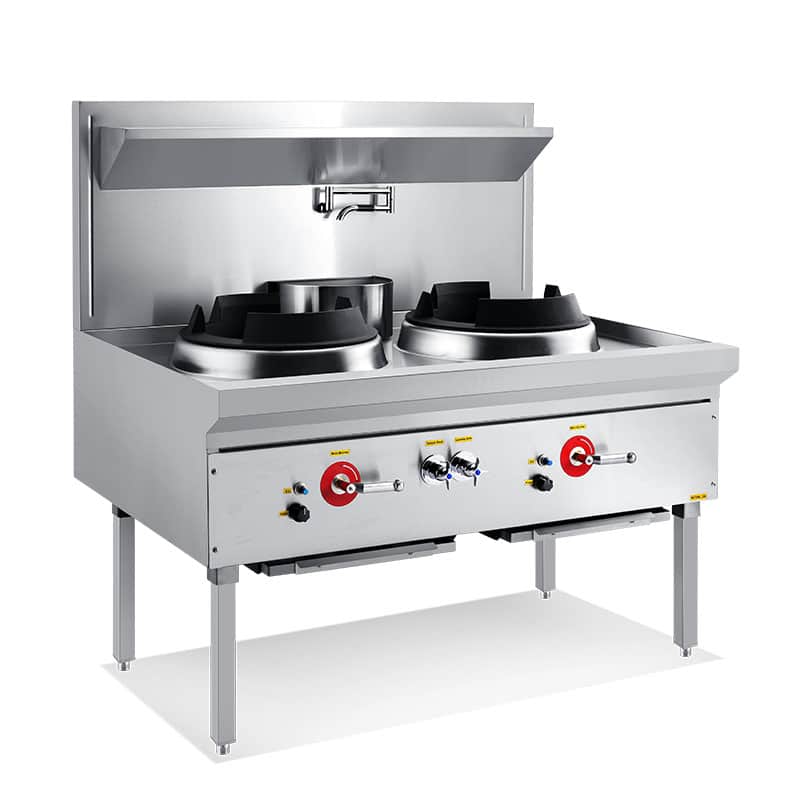
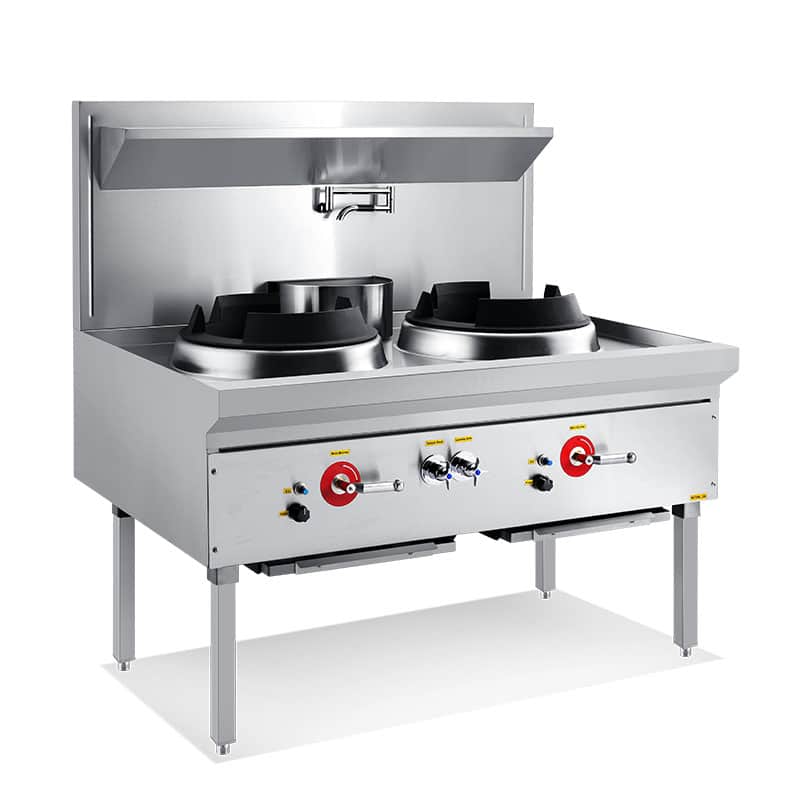
Open-flame gas wok burners typically convert only about 30–35% of purchased gas energy into heat that actually cooks food; the rest heats the room and drives extraction demand. That gap is the main “free lunch” for operational fixes and equipment upgrades. Third-party comparisons often cite induction utilisation in the 90%+ range at the hob—still validate against your tariff, menu, and duty cycle.
Professional kitchens pair woks with burners shaped for the pan: high output, often multi-hole or ring / jet / duck style heads on dedicated ranges. Round-bottom woks suit traditional cup-style burners; flat-bottom woks sit on a wider set of surfaces, including many induction units—always confirm cookware compatibility. Buyer guides typically distinguish low-pressure vs high-pressure gas burners (wide BTU spans), stockpot burners, integrated wok ranges, and waterless designs that reduce energy spent cooling with water decks. Historical context from traditional charcoal through gas to modern efficiency-led equipment also supports this transition framing.
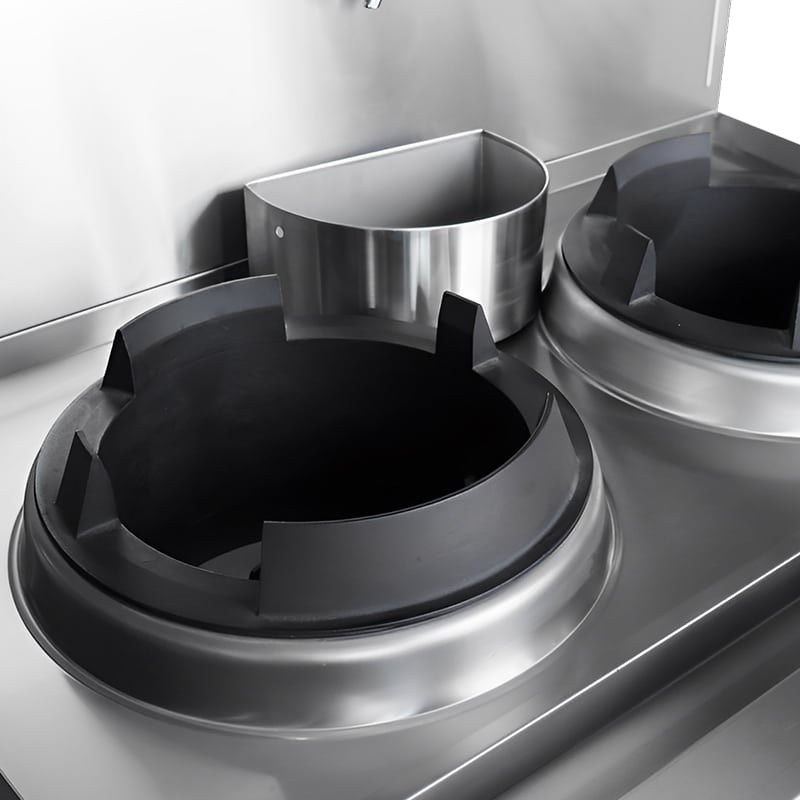
Design details such as the black steel containment ring around the wok well can support efficiency by keeping more hot gases focused around the pan envelope, instead of spilling rapidly into ambient room air. In practical terms, this supports faster heat transfer to the cookware and can reduce avoidable burner-on time at service peaks—especially when combined with disciplined flame settings and strong maintenance.
| Path | Heating model | Indicative efficiency (literature) | Energy / ops note |
|---|---|---|---|
| Gas wok (open flame) | Flame → air + pan | ~30–35% to food (often quoted) | Strong hood & make-up air; idle flame expensive. |
| Electric (element / hotplate) | Element → plate → pan | ~50–55% (typical teaching range) | Slower response than gas/induction for some menus. |
| Induction wok | EM field → pan directly | ~90–95% (vendor / trade articles) | Requires ferrous woks; pan detection can trim idle draw. |
Numbers are industry ballparks for planning—meter your own line and normalise for service intensity.
Because Greenways does not currently sell full wok ovens, this deep-dive comparison focuses on practical accessories and burner components that can improve gas and water efficiency while extending the life of your existing line.
Focuses flame toward the wok base to reduce side-wall heat loss. This improves heat transfer efficiency and usually cuts burner-on time.
Typical gas saving: ~10–25%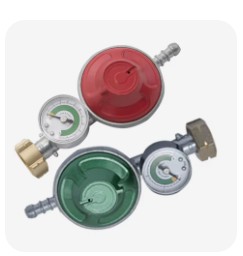
Improved burner head geometry and airflow mixing keep usable heat wrapped around the pan for stronger combustion and less wasted flame.
Typical gas saving: ~15–30%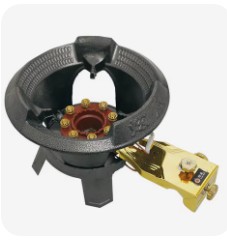
Helps keep flame output stable and appliances operating inside target pressure ranges. Better control supports consistent combustion and avoids over-firing.
Typical gas saving: ~5–12%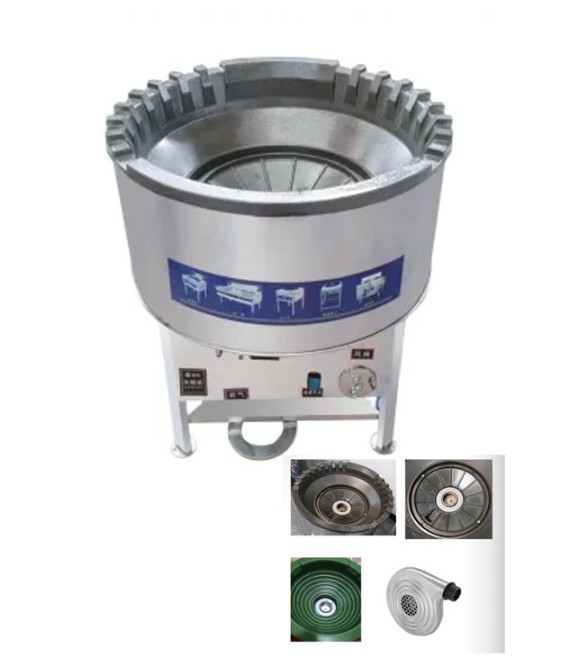
Modern bowl and jet designs improve thermal containment and can reduce unnecessary cooling or rinse demand around the station.
Gas + water efficiency uplift (site dependent)Combined upgrades are often where the strongest results appear. In many kitchens, pairing a focused flame ring with an efficient burner design can deliver ~20–40% total gas reduction, plus faster response and better control.
Low-cost discipline improvements often deliver the fastest savings before any equipment upgrade.
After reducing open-flame intensity, ventilation optimisation can unlock additional electricity savings.
| Window | Action | Typical cost | Impact (guide) |
|---|---|---|---|
| Immediate | Brigade training — idle discipline, mise, batching | Low | ≈10–15% gas or demand |
| Immediate | Burner cleaning & maintenance cadence | Low | ≈5–10% |
| Short-term | Induction wok upgrade (phased if needed) | Higher capex | Often large fuel reduction vs legacy flame — meter it |
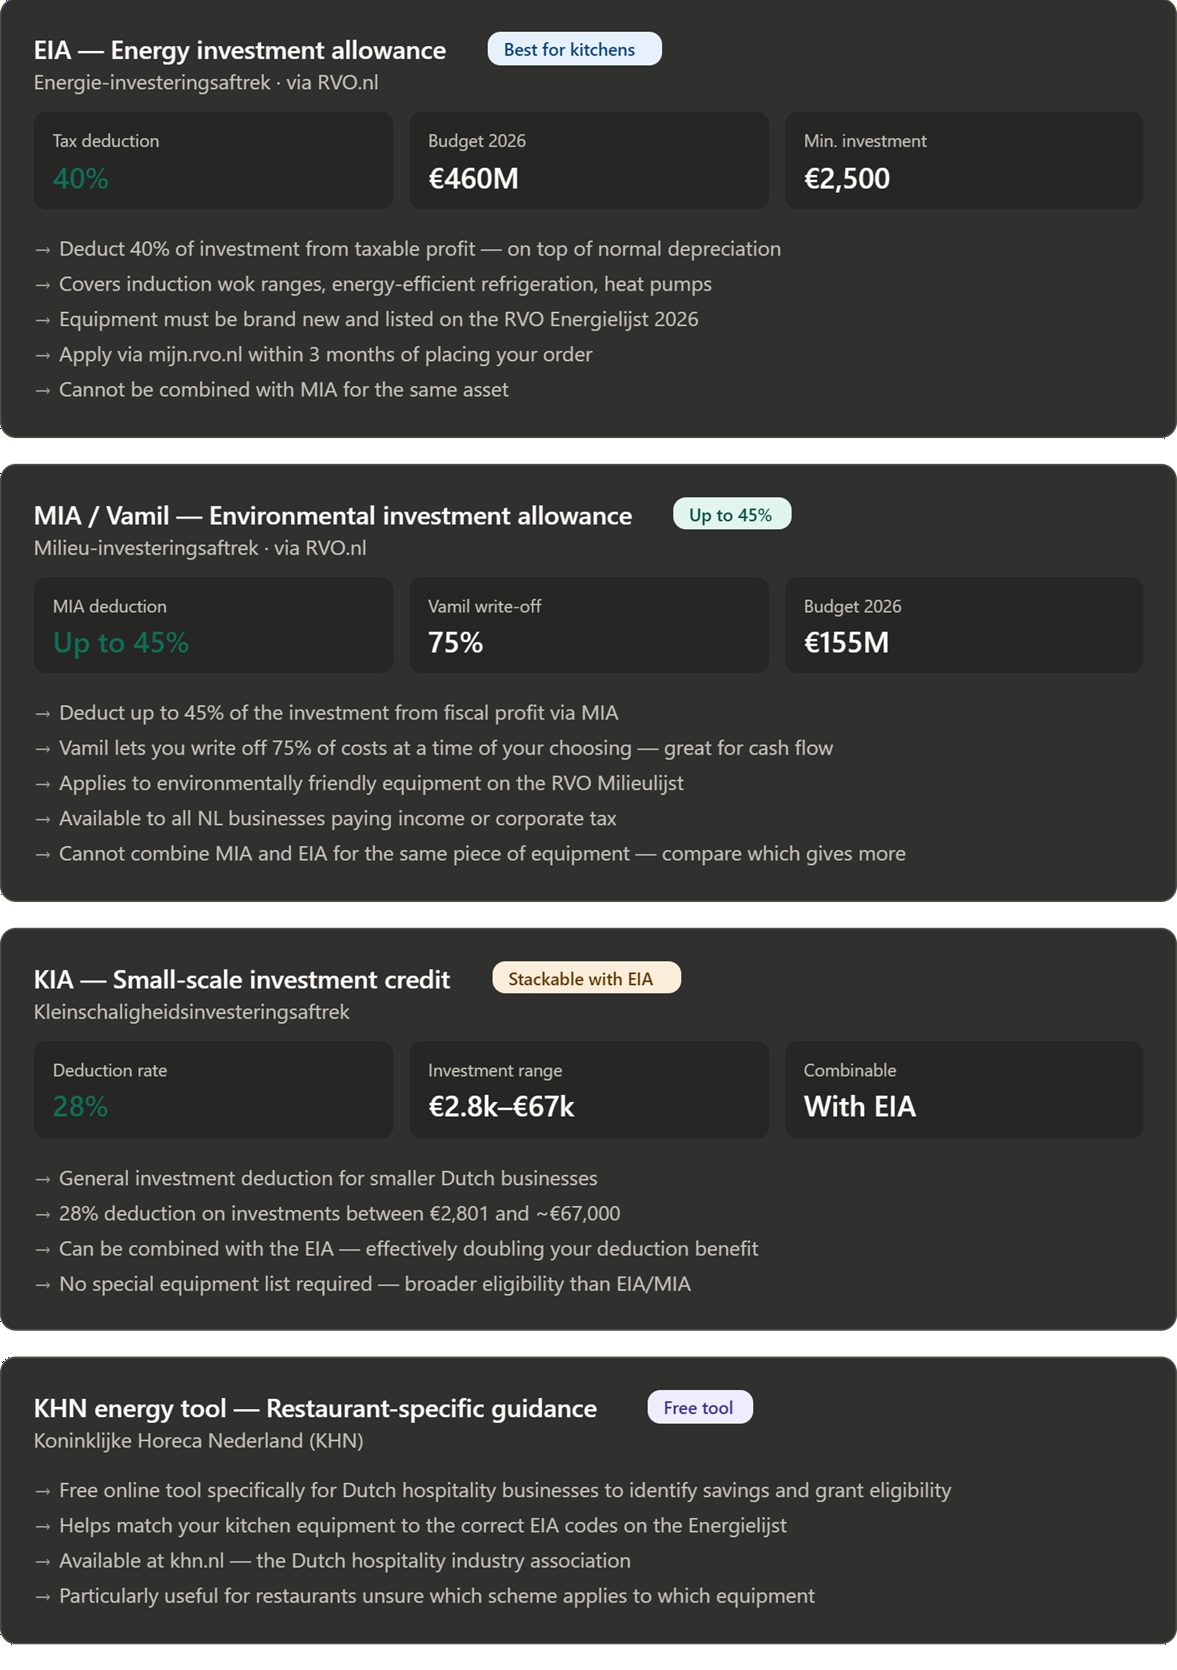
| Short-term | EIA paperwork where eligible | Admin time | Payback helper |
| Medium-term | Re-balance hood / MAU after fuel change | Varies | Ongoing elec / thermal savings potential |
There are currently more subsidies and grants available for replacing high enegy use appliances with low-efficiency equipment than ever before. Through the Greenways portal, you can access updated grants and subsidy pathways to help replace high-energy restaurant assets with lower-consumption, ETL-registered alternatives. Learn more about ETL-listed products here: Energy Technology List products.
Figures vary by tariff, brigade discipline, throughput, hood design, and equipment spec. Measure before major spend, model peak and idle shifts, then re-meter after changes. Greenways can help turn this into a payback appendix—ask your account contact.
What it is. Aeroseal is an automated duct-sealing approach used in residential and commercial buildings. A certified technician pressurises the duct network and introduces a specialised, low-toxicity aerosol sealant. Sealant particles are carried to leakage paths and accumulate at the edges of gaps, forming a lasting seal from the inside — without coating the entire duct surface.
In practical terms for your team: instead of patching obvious leaks only, the process targets leakage across the tested system more systematically.
Commercial kitchens often run extraction and ventilation for many hours each day — sometimes alongside comfort cooling or heating. Industry studies commonly cite substantial duct leakage in commercial buildings (order-of-magnitude ~30% of conditioned or moved air in some inventories). Hidden leakage means fans and plant work harder, comfort can drift, and energy spend rises even when hoods “look” correctly sized.
If you operate high-duty extraction (including gas-flame-intensive lines such as traditional wok cooking), reducing duct leakage may help extraction and HVAC interact more efficiently. Your savings will depend on your current leakage, airflow design, tariff, controls, and how much of the leakage is reachable and testable.
Sealed duct paths can trim fan-energy waste and unrelated heating/cooling burdens where leaks were forcing oversized airflow or conditioning. Any gas heating savings are site-specific.
In European benchmarking material, leakage rates have reportedly been reduced by very large percentages in studied projects — your facility may differ sharply. Contractors and regional studies may quote wide ranges (roughly 20–40% savings on HVAC or fan-energy components in some retrofit narratives). Treat every figure below as a planning guide; validate with blower-door / duct-testing baselines before and after, and reconcile against your metering.
Yes, Aeroseal has been marketed in European markets since the mid‑2010s. Documented sealing projects span many countries across the region.
To identify a contractor for your postcode, review the distributor’s locator on aeroseal.com/europe (typically “Find a Pro” style search by country).
| Measure | What it targets | Indicative impact (guides only) |
|---|---|---|
| Aeroseal (duct scope) | Systematic sealing of leaky duct seams and joints where included in programme | Contractors often cite ≈20–40% HVAC or fan-energy reduction potential — meter to verify |
| Gaskets & appliance doors | Stem thermal bleed from cooking and refrigeration openings | Typical housekeeping gains on the order of a few percentage points for affected equipment cohorts — varies widely |
| Filter maintenance | Hold down fan watts by reducing needless pressure drops | Commonly referenced ≈5–10% band on marginal fan-energy where filters were overdue — inspect your trend data |
Figures summarise industry marketing and tertiary studies — they are not a guarantee for your site. Commission a leakage survey, agree scope with a certified Aeroseal partner, then compare half-hourly or daily energy before versus after normalization for weather covers.
If you would like support finding a Netherlands-based certified installer, scoping leakage testing, or building a concise payback appendix for landlords or investors, ask your usual Greenways contact and we will line up next steps.
Does not replace sub-metering or fiscal advice. Open Equipment Intelligence for product-linked benchmark handoffs when available.
Illustrative kWh/day paths over six months: your current line load if nothing changes, a service / tune-up trajectory when the asset sits above the benchmark band, and a matched upgrade from Greenways or external suggestions when available. Grant text uses linked scheme data from the decision matrix when present — not an offer of funding.
Figures scale the same utility model as Cost & footprint (tariffs above). Service savings are a planning band, not a metered guarantee.
data/sustainable-products-catalog.json (sust_*). Finder runs and manual adds both feed this column.etl_*). If no product is currently listed, this block confirms there is no direct match yet.